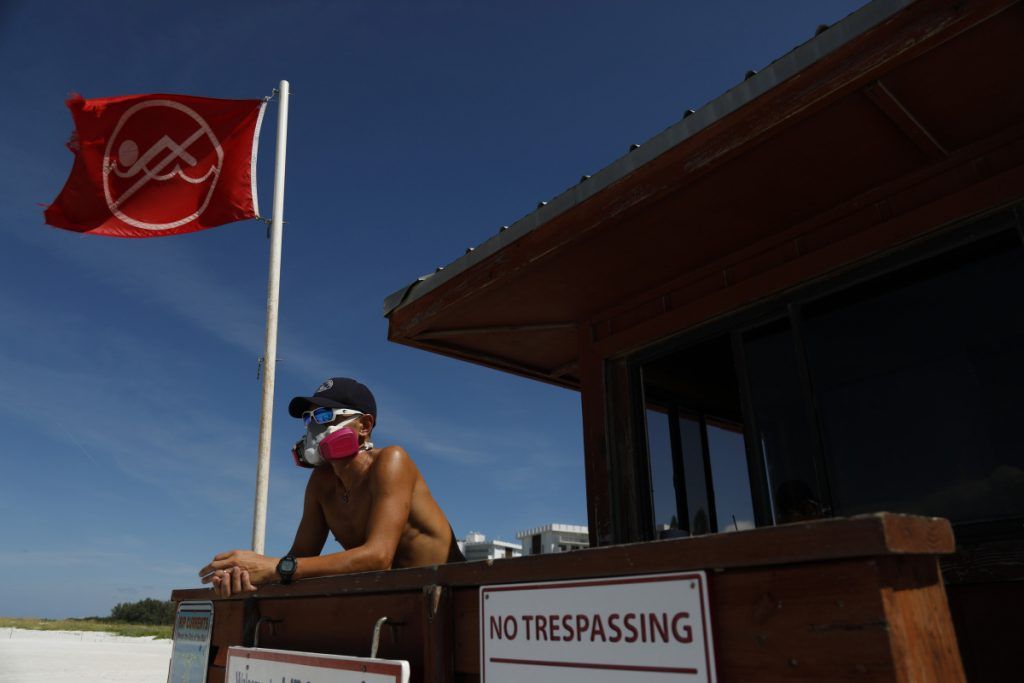
While a Senate hearing on the current red tide situation plaguing Florida's waterways may do some good in the long term, boaters need to know what the conditions are right now.
Below are the most recent updates available from the Florida Fish & Wildlife Conservation Commission (FWCC) as of August 31. These Reports are updated on Friday afternoon except during holidays, in which case the report will be released on the closest day. Additional information, if available, is provided on Wednesday afternoon.
To see detailed information on this week's samples, view the current Statewide Google Earth map for August 31, 2018. By using Google Earth, you can zoom in to specific locations and click on stations to see detailed information, including sample date and cell concentration. You must have Google Earth installed on your computer to view this map; the software can be downloaded from the Google Earth website.
Red Tide Status Information: View status of red tide events online or call for red tide status from within Florida 866-300-9399, from outside of Florida 727-552-2448.

Current Conditions
A bloom of the Florida red tide organism, Karenia brevis, persists in Southwest Florida and continues to extend from Pinellas to Collier counties along ~145 miles of coastline. Observations of >1,000,000 K. brevis cells per liter (“high” concentrations) occurred offshore of Pinellas and Hillsborough counties for the first time this week, and continued in areas of Sarasota, Charlotte, Lee, and Collier counties. Relative to last week, multiple locations in Manatee, Sarasota, Charlotte, and Collier counties showed decreased cell concentrations, and no “high” concentrations were observed in Manatee County. Surface currents over the past several days are likely playing a role in transporting cells of K. brevis to the northwest, and are expected to continue based on short-term forecasts. An aerial survey conducted last week and vessel-based surveys this week indicated the presence of offshore blooms of the marine cyanobacterium, Trichodesmium. More specific details are provided below.
- In Southwest Florida over the past week, K. brevis was observed at background to high concentrations in or offshore of Pinellas County, low to high concentrations offshore of Hillsborough County, background to medium concentrations in Manatee County, background to high concentrations in or offshore of Sarasota County, very low to high concentrations in or offshore of Charlotte County, background to high concentrations in or offshore of Lee County, and very low to high concentrations in or offshore of Collier County. For additional information, view the Southwest Coast report and map .
- In Northwest Florida over the past week, K. brevis was observed at background concentrations in one sample collected from Gulf County and one sample collected offshore of Pasco County. For additional information, view the Northwest Coast report and map.
- Samples collected along the east coast of Florida over the past week did not contain K. brevis. For additional information, view the East Coast report andmap .
Fish Kills
Over the past week, reports were received for multiple locations in Pinellas, Manatee, Sarasota, Charlotte, Lee, and Collier counties. More detailed information is available at http://myfwc.com/fishkill.
Respiratory Irritation
Respiratory irritation was reported over the past week in Pinellas, Manatee, Sarasota, Lee, and Collier counties. For additional information, view the Southwest Coast report .

Forecast
Forecasts by the USF-FWC Collaboration for Prediction of Red Tides for Pinellas to northern Monroe counties predict net northwestern movement of surface waters in most areas and net southeastern transport of subsurface waters over the next three days.
Red Tide Status Map (August 31, 2018)
To see detailed information on this week's samples, view the current Statewide Google Earth map for August 31, 2018.
By using Google Earth, you can zoom in to specific locations and click on stations to see detailed information, including sample date and cell concentration. You must have Google Earth installed on your computer to view this map; the software can be downloaded from the Google Earth website.
On August 30, the U.S. Senate Committee on Commerce, Science, and Transportation Subcommittee on Oceans, Atmosphere, Fisheries, and Coast Guard held a hearing on “Harmful Algal Blooms: The Impact on Our Nation’s Waters.” Bart Johnsen-Harris, Clean Water Advocate for Environment America, issued the following statement:“Toxic algal outbreaks are not new, but they are getting worse. We can stop these algal outbreaks only if we stop the pollution that feeds them.From Florida to the Great Lakes to California, we are seeing widespread outbreaks of toxic algae in our waterways. The outbreaks taint our drinking water and our beaches, kill wildlife and pets, and put our children in harm’s way.Pollution causes most of this toxic algae. Manure and fertilizer from agribusiness, sewage overflows and stormwater runoff all release nitrogen and phosphorus into our waterways. These “nutrients” help make things grow, and in the water, they create a virtual feeding frenzy for algae. We need to start reducing this algal-inducing pollution now. While data can be helpful, more monitoring and studies alone will not halt the pressing public health threat of toxic algal outbreaks.


- 4,000 Marinas
- Thousands of anchorages
- Updated Charts
- Mile-by-Mile Navigation
- Highlighted Alerts & Cautions
- Full-Color Aerial Photographs
The Waterway Guide App Makes it easy to leave reviews, use our explorer, and view waterway guide materials all on the go!